Every Number Is Correct. The Story Is Wrong.
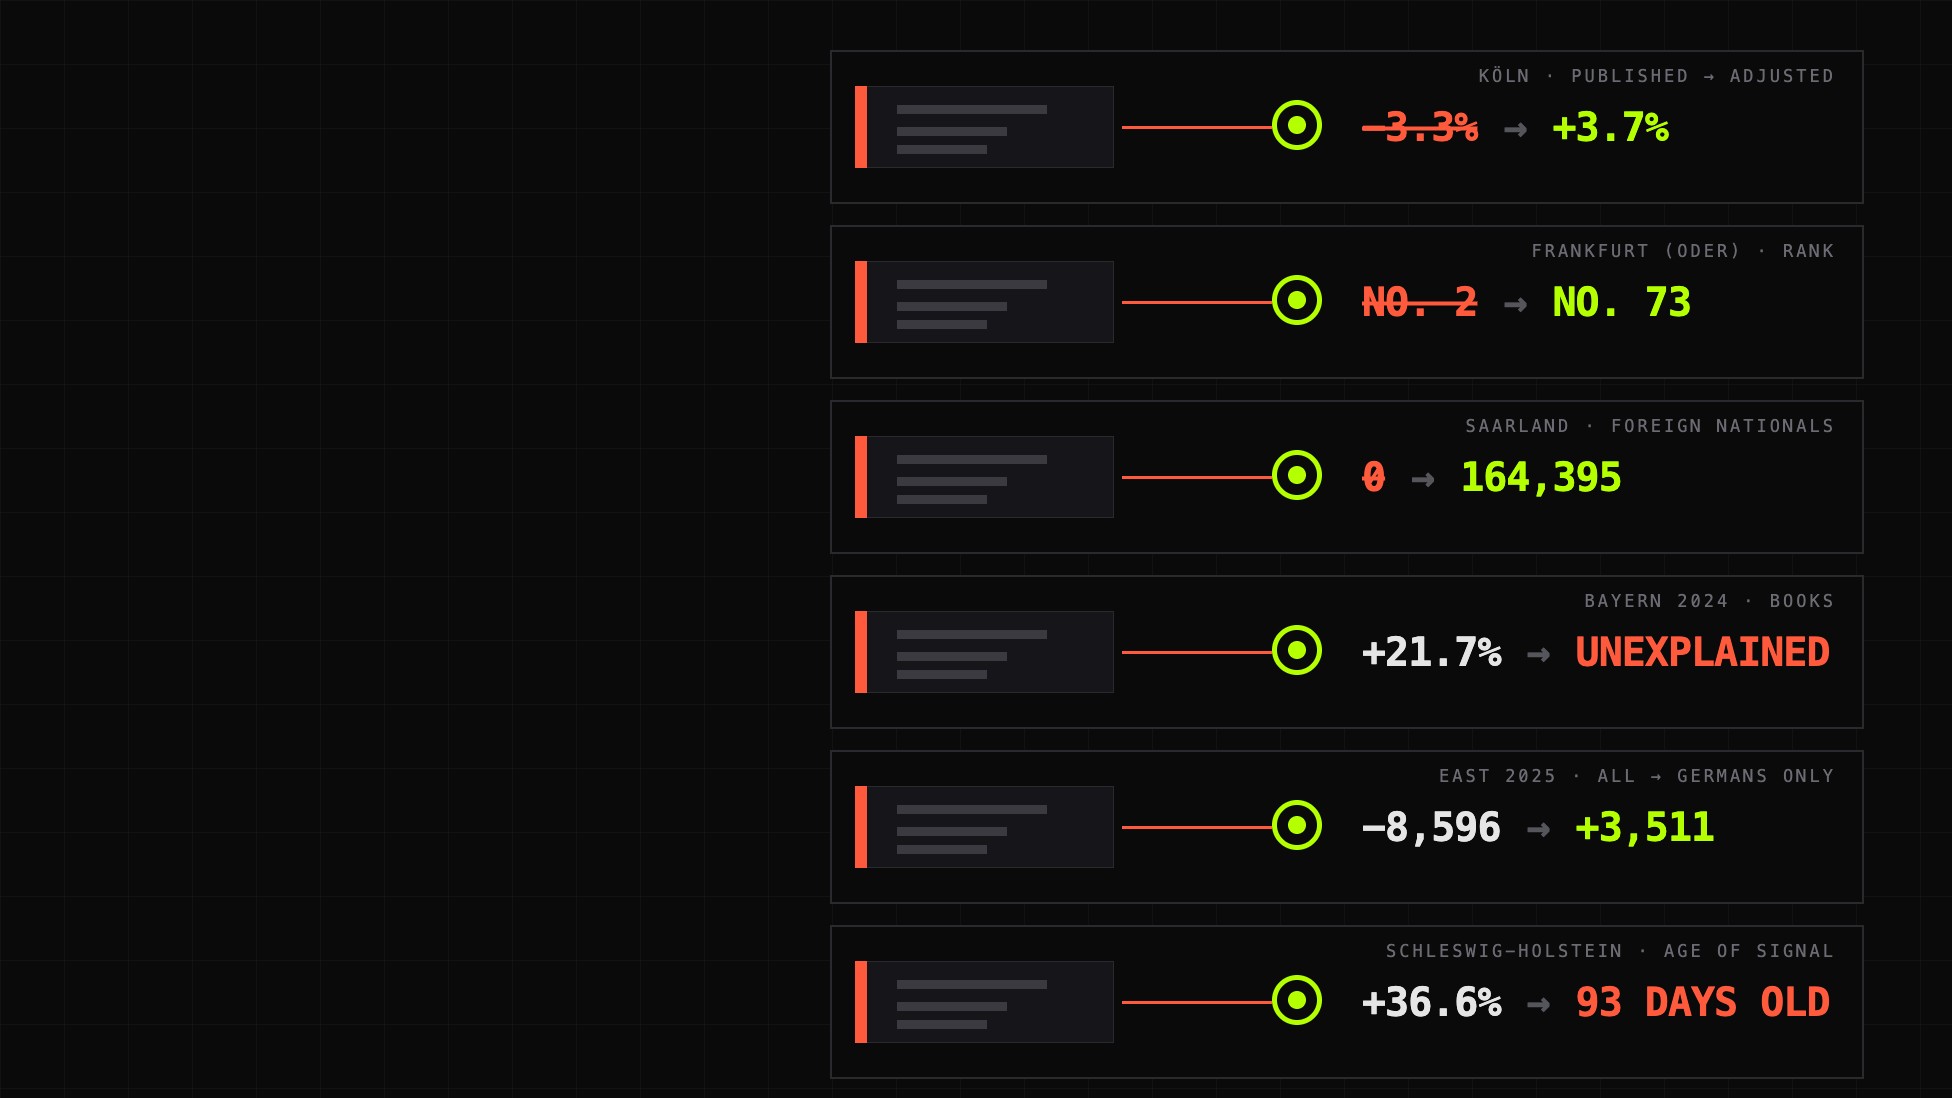
Köln lost 64,000 residents in a single day, and nobody moved. Saarland “has no foreigners”. One district is “the second most dangerous in Germany”. We checked six stories against Germany's own official data.
On 15 May 2022, Köln lost about 64,000 residents. In one day.
Nobody moved. Nobody died. Germany had held a census, the census found fewer people than the registers said, and the official number was reset. Köln has since gone to court over it.
Now watch what that one day does to a ten-year trend. Between 2015 and 2025, according to Destatis, Germany’s federal statistics office, Köln lost 3.3% of its residents. Trier lost 8.6%. Halle lost 4.6%. Put them together and you can write a headline in about a minute:
German cities are shrinking.
Every number in that sentence is official. And the sentence is wrong. Measured the same way at both ends, Köln grew, by about 3%.
The numbers are not the problem. What we read into them is. A figure can be true and still tell you the opposite of what happened.
So we went looking for the others.
We pulled real data from Destatis, from the Federal Criminal Police Office (BKA) and from EU law into one system: population for all 400 districts, ten years of it, plus crime, migration, the monthly economy of the 16 states, press releases, and the catalogue of the statistics office’s own tables. Then we asked a simple question of each story you could easily build from that data: what would have to be true for this to be right, and is it?
None of the six survived intact. Here is what was hiding in each.
| The story | The official number behind it | What is really going on | |
|---|---|---|---|
| 1 | German cities are shrinking | Köln −3.3%, Trier −8.6%, Halle −4.6% | A census reset hides inside every one of them |
| 2 | The East is emptying again, and Berlin’s suburbs boom on arrivals | East −8,596 net in 2025 | True, and not what it sounds like |
| 3 | Frankfurt (Oder) is the second most dangerous district in Germany | 14,303 recorded cases per 100,000 | Number 73 once the border is out |
| 4 | Saarland has hardly any foreigners | A dash in five of six districts | The dash is an address, not a zero |
| 5 | Bayern’s population books do not balance, so the statistics are broken | 24,814 people unexplained in 2024 | The gap is real. “Broken” is not |
| 6 | Insolvencies are surging in Schleswig-Holstein, because of construction, and unemployment will follow | +36.6% | The surge is real. Both explanations fail |
Whose numbers are these? Two kinds appear below, and we keep them apart. Official figures are read straight from a published table or press release. Our estimates are computed by us from those tables: the 57 districts, the corrected crime ranks, the size of Bayern’s gap. Where a figure is ours, the text says so. The sources are listed at the end.
How does a city lose 64,000 people in one day?
On 15 May 2022 Germany held a census, and it found about 1.4 million fewer people than the running estimate had been assuming: 82.7 million. Seven in ten of the missing were foreign nationals; a move abroad is easy to make without deregistering. Every official population series was then reset to the new count, from 2022 onward. The years before were left as they were.
So any figure that compares the years before 2022 with the years after contains two things at once: people moving, and a correction.
For Köln the official correction is about 63,800 residents, 5.9% of the city. Its entire published decline from 2015 to 2025 is 35,059. Take the correction out and Köln goes from −3.3% to about +2.7%. The city’s own population register agrees on the direction: it counted 1,092,607 main residents at the end of 2025, some 67,000 more than the official figure. In June 2025 the city filed a claim against the census result.
Köln has an official figure for its correction. Most districts do not. So we estimated one for every district, using nothing but each district’s own published numbers. The foreign-national figures come from a register the census did not reset, so we take residents minus registered foreign nationals and look at the jump between 2021 and 2022, beyond that district’s usual yearly step. This is our method, not Destatis’s.
By that estimate, in 57 districts a published decline disappears once the reset is taken out. You would guess these are big cities. They are not: only 22 of the 57 are cities. Halle goes from −4.6% to +2.1%. Trier goes from −8.6% to +0.1%: not growing, but standing still. And it can run the other way. In Pforzheim the census added an estimated 6,354 people, so the published +10.0% is really +4.8%.
Is the estimate any good? We checked it twice. Added up over the whole country it gives −1.48 million against the 1.4 million Destatis states: 5.8% apart. For Köln, the one district where we can compare, it gives −74,346 against the official 63,800, so it runs high there, and our figure for Köln’s growth (+3.7%) is a point above the one built on the official correction (+2.7%). Close enough to flip a sign. Not close enough to quote to the last digit.
So who is actually shrinking? By our estimate 59 districts still shrink after the correction. 56 of them are also ageing fast, and 42 of those 56 are in the East.
One question we cannot answer: whether university towns carry the biggest corrections. No table says which districts have a university, and we are not going to guess.
Is the East emptying again?
The first half of that story is true. East Germany, counted without Berlin, lost 8,596 people net to the West in 2025. Destatis reports the same figure, rounded to 8,600. It is the third loss in a row after six years of small gains.
Look inside the number. German nationals alone gained 3,511. In 2000 the East lost 75,951 people, and 68,806 of them, nine in ten, were German. That was the old exodus. This is not it. The routes carrying today’s loss are mostly foreign nationals moving on: from Sachsen-Anhalt to Nordrhein-Westfalen, 58% are foreign. From Thüringen, 53%. From Sachsen, 49%.
One caution, so that we do not swap one easy story for another. The German surplus is shrinking: +15,743 in 2021, +3,511 in 2025. If it turns negative, the old headline becomes true again, and the same table will show it first.
The second half, that Berlin’s suburbs boom because of arrivals from abroad, fails the same test. All eight growing districts around Berlin grew between 5% and 13%, and all eight still grow, by 1.8% to 5.1%, with the increase in foreign residents taken out. Berlin sends 31,071 people to Brandenburg and gets 18,619 back. That is ordinary suburbanisation.
And one correction to ourselves. Our first reading said nine districts were short of housing, with residents growing faster than homes. Checked against the raw figures, it holds in one. In the other eight the “shortage” was the census correction again: the building census reset the housing stock too. The system keeps that as a finding of its own, pressure made by the census, right next to the real one.
Is Frankfurt (Oder) really the second most dangerous place in Germany?
On the headline number, yes. In the BKA’s district table for 2025, Frankfurt (Oder), a town of 57,000 on the Polish border, has 14,303 recorded cases per 100,000 residents. Rank the 400 districts by that rate and it is number two, above Berlin.
But 48% of everything recorded there, 3,935 of 8,168 cases, is one kind of offence: entering or staying in the country without papers. Those offences are recorded where police find them, and police find them at the border. Across Germany they are 3.8% of recorded crime. The BKA publishes the total without them. Rank by that, and Frankfurt (Oder) is number 73.
It is not alone. Freising, next to Munich airport, drops from 119 to 324. Berchtesgadener Land goes from 62 to 236. Dahme-Spreewald, home of Berlin’s airport, falls from 18 to 100. Eight districts in total.
Corrected, the top ten are all independent cities, led by Bremen, Berlin and Halle. Across 391 districts the corrected crime rate follows how dense and how socially strained a place is. The ranks are ours, built from the BKA’s table. And one sentence belongs on every map built from this data: these numbers say where crime is recorded, not who commits it.
What does a dash mean in a statistics table?
According to the legend: nothing there.
Five of Saarland’s six districts show a dash for foreign nationals. If you take the table at its word, Saarland has hardly any.
The sixth district, Saarlouis, shows 164,395 foreign nationals for 204,087 residents. That is 81%. If you take the table at its word again, four in five people in Saarlouis are foreigners.
Neither is true. Saarland has a single immigration office for the whole state, and it sits in the district of Saarlouis. The register books every foreign national in the state at that address. 164,395 is all of Saarland, which has just over a million residents: 16%, not 81%. The dash does not mean zero. It means counted at the office. Destatis does explain this, in a footnote. The table shows a dash.
The same thing happens to Landkreis Kassel, which shares its office with the city of Kassel and is booked there. And Spree-Neiße shows a dash with no footnote that names where its people went. Neighbouring Cottbus is the obvious suspect. We could not confirm it, so we say that too.
The same trap catches cars. Trier shows 1,511 cars per 1,000 residents, more cars than people. Trier is not a city of collectors. It shares a registration office with the district around it, Trier-Saarburg, which has no car figure at all. Count the two together and the answer is 626. Wolfsburg, at 954, is the other variant: company fleets registered at the carmaker’s seat.
The practical result: nine districts must stay out of any per-capita figure on foreign nationals, Trier and Trier-Saarburg out of any on cars, and we do not yet know whether more are hiding without a dash.
Do Germany’s population books balance?
Population at the end of a year should equal the population at the start, plus births, minus deaths, plus net migration. Four published tables, one equation. We ran it for every state and every year since 2000.
It breaks in 27 state-years, all of them in 2011 and 2022, the census years, as it must.
Outside the census years we measured what is left over against that year’s births. In 33 more state-years the leftover is larger than 5% of the births. Bayern in 2024: the population grew by 72,502, and births, deaths and migration explain 47,688. That leaves 24,814 people, as if 21.7% more children had been born than were. Sachsen in 2025: 4,957 people. Mecklenburg-Vorpommern in 2025: 7,421, where the tables predict a loss of 7,333 and the population did not move. Berlin and Bremen miss by more than 5% of births in nine years each.
Keep the scale in view. 24,814 people are 0.19% of Bayern. That is a gap in four tables, not a broken statistic.
There are two explanations on the table: migration was undercounted and will be revised, or registers were cleaned up after the census. The official population figure does include register corrections, and they are not in the four tables we combined, so the data we loaded cannot separate the two. “The statistics are broken” is stronger than anything it supports. “The census did it” is simply wrong for 2024.
There is a side story about trust. Tables vanish. On 13 September, 118 Destatis tables were listed but empty. Four days later only two were. On 19 September, 62 different tables had gone dark. 116 of the first 118 turned out to be reloads, not withdrawals, and a single look cannot tell the difference. A dated history can.
Can you warn about a crisis with data that is already months old?
Company insolvencies in Schleswig-Holstein are up 28.6%, then 31.8%, then 36.6% in the three-month windows ending in January, February and June 2026: 291 cases against 213 a year earlier. The surge is real. The national headline checks out against the table to the digit: 2,266 insolvencies in June, up 15.8%.
Then comes the explanation, and it falls apart in two places.
Is construction to blame? In February, yes: construction was 45% of the rise. By June no sector is above 40%, and the widest, trade and repair of vehicles, is 24%. The story changed in four months.
Does unemployment follow insolvencies? We tested that on the last time the cycle turned. In January 2024 unemployment turned up in Hamburg, Bremen, Rheinland-Pfalz, Berlin and Sachsen at the same time. The insolvency surges in those states came two to three months later. The labour market moved first.
And every one of these signals is old, in two ways. The June figures were published on 11 September, ten weeks after the month ended. And Destatis notes that a case enters the statistics only at the court’s first decision, which in many cases comes about three months after the company filed. A “June” insolvency is typically a March filing, read in September. A warning built on it is a statement about spring.
How did we catch all of this?
Four ideas do the work, and none of them is a dashboard.
Checks that judge, not tags. Seven checks read the records and compute every finding themselves: the census effect for each district, the dash that is not zero, the surge in the month a streak starts. Change a number in the data and the finding changes with it. Nothing is typed in by hand.
A glossary that gives every finding a meaning. “Census effect”, “counted at the seat” and “pressure made by the census” are defined once, in plain English, and every kind of finding is bound to the concept it means. The bindings go beyond labels: a district’s trajectory is read from the value of a finding, a mention of Sachsen means East Germany, and the dash in a table cell is read through a definition that explains why it is not always zero.
Named things, not strings. 416 states and districts, 23 tables and a handful of publishers are entities. Köln’s page gathers its profile, its crime record and the notes that mention it, from four different sources, and shows which tables its numbers come from.
Questions that follow meaning. Which figures are counted in the wrong place? is defined by one concept and returns 19 findings from four different checks. Nobody wrote a search for it.
On top of that, every story became a case with competing explanations, evidence for and against, and a verdict that can change. Six cases, 32 hypotheses. Some are supported, many are refuted, and several are left open, because that is what the data actually allows.
Three questions that would have caught all six
Since when? Is there a reset, a new definition or a publication delay inside the period? That is Köln, and it is the insolvency that was filed in March.
Counted where? At the home, or at the office? That is Saarland, Trier, and a border town’s crime rate.
Who is inside the total? That is the East, where the total and the German nationals point in opposite directions, and Bayern, where the total contains a column the tables do not show.
What we cannot say
The census effect is an estimate, not a measurement, and for the one city where we can test it, it runs high. Taking the reset out compares both years on the old basis. The registers drifted over a decade, so part of the overcount was probably already inside the 2015 figures, and no table says how much: the direction is solid, the last digit is not. Recorded crime counts what police register, and depends on reporting and on police activity. A corrected ranking is better, not neutral. A correlation between crime and foreign share is described and never turned into a cause. And a question the data cannot settle, like the university towns, stays open instead of getting a guess.
Look for yourself
The workspace is live, with every source, check, concept, standing question and case described above:
showcase.classifyre.com/atlas-regional-research
A three-minute tour:
- Open the case Are Germany’s big cities really shrinking? and click the first hypothesis. Watch Köln, Trier and Halle light up.
- Open the entity Köln and look at where it is mentioned.
- Open the case Whose people and cars are counted in the wrong place? and find Saarlouis on the board. It is the district that carries a whole state.
Sources
The official figures, and where to check them:
- Census 2022, 82.7 million and about 1.4 million fewer: Destatis press release and the recalculation of the population series.
- Köln, 1,017,355 and about 63,800 fewer: the city’s questions and answers on the census, its claim against the result and its own register count for 2025.
- Why the register of foreign nationals was not reset: Destatis, differences between the two sources.
- East and West, −8,600 in 2025: Destatis, migration between East and West; the split by nationality is in GENESIS table 12711-0022.
- Crime: the BKA’s district table of the Polizeiliche Kriminalstatistik 2025, and the Brandenburg police report for 2025, whose 15,384 residence-law offences match the 15,368 in our district rows.
- Saarland’s single immigration office and the shared office in Kassel: Destatis, foreign population by census and register, footnotes 1 and 2; the state total of 164,395 is in foreign population by state.
- Trier’s joint registration office with Trier-Saarburg: Stadt Trier.
- Insolvencies, 2,266 in June 2026 and the three-month note: Destatis and press release 325.
More case files

One Bad Friday at a Pump Factory: Four Rescue Ideas, and the One the Evidence Left Standing
A delivery slips by two weeks and three orders hang on it. Four rescue ideas go on a case board as hypotheses, and one survives. A case file on Nova Manufacturing: an invented pump maker on a real workspace.

A Company Register That Watches Itself
Three cases on Austria's company register that add and drop companies on their own as filings arrive. In their first seven hours live, they took in 123 answers without a person touching them. Here is how we built them, and what they will not claim.

How AI Investigated 9,601 Hillary Clinton Emails
See how Classifyre autonomously investigated 9,601 Hillary Clinton email files, tested 20 detectors, and opened eight evidence-backed cases.